This post originally appeared on ImpactAlpha, the leading news publication purpose-built to cover impact finance.
Our vision is a world where all investors and enterprises collect useful information about their material effects on people and planet and therefore improve performance.
So far in this Operation Impact series, we’ve discussed the need to be more transparent with the data we have (see, “Culture of transparency: Putting impact investing on the map”) and more honest about what it will take to collect it (see, “Lean Data: The ‘how’ of measuring impact at lower cost for higher value”).
Now we will explore a different angle — making sure our impact data tells us something genuinely useful.
The act of measurement — the mere collection of impact data at all — should not be the real differentiator between impact investing and “other” investing. Instead, all investments would differentiate themselves based on the impact they have.
Hundreds of people and organizations, from across disciplines and around the world, have come together through the Impact Management Project to agree on the fundamentals of impact performance that really matter. All consensus reached over the past year is available publicly online under a Creative Commons license at www.impactmanagementproject.com.
We started by asking people how they describe their experience when engaging with an organization. We have agreed on five dimensions that describe the experience of people and planet, both positive and negative. We can track performance across those five dimensions — what outcomes the investments drive, how much, for whom, the contribution they make and the risk they take.
Useful data
In traditional finance, metrics are useful when they:
Tell us about the fundamentals of performance that we widely agree matter to us, such as return, volatility and liquidity. These shared fundamentals mean that the same data can be understood by a wide range of stakeholders — executives, investors, governments, customers, researchers and auditors alike.
Are presented as a set of information that helps us to benchmark and improve performance. If we only have data on financial return without understanding, for example, the volatility or liquidity — and no ability to compare to relevant peer benchmarks — it would be hard to know whether we’re doing well or badly, or whether we should change course.
When is impact data useful? It’s been tempting to talk about a few metrics that look good, like “number of lives touched” or “number of jobs supported.” This makes it seem like negative effects — such as the carbon emissions that most organizations generate — are not also part of our impact story and in need of management.
We also very often present such metrics individually, as though a data-point like “jobs supported” can be interpreted as good or bad. How can we benchmark a metric like this unless we know the job quality, the demographics reached (in terms of how easy or hard it is to support those people with employment), how long the jobs are sustained and the financial performance of the organization generating the effect?
Useful impact data — data that we can use to understand which of our effects on people and planet are really good or really bad, and therefore to change our course — gives us a multi-dimensional picture of impact performance, alongside financial performance, in a way we can all understand.
Five dimensions of impact
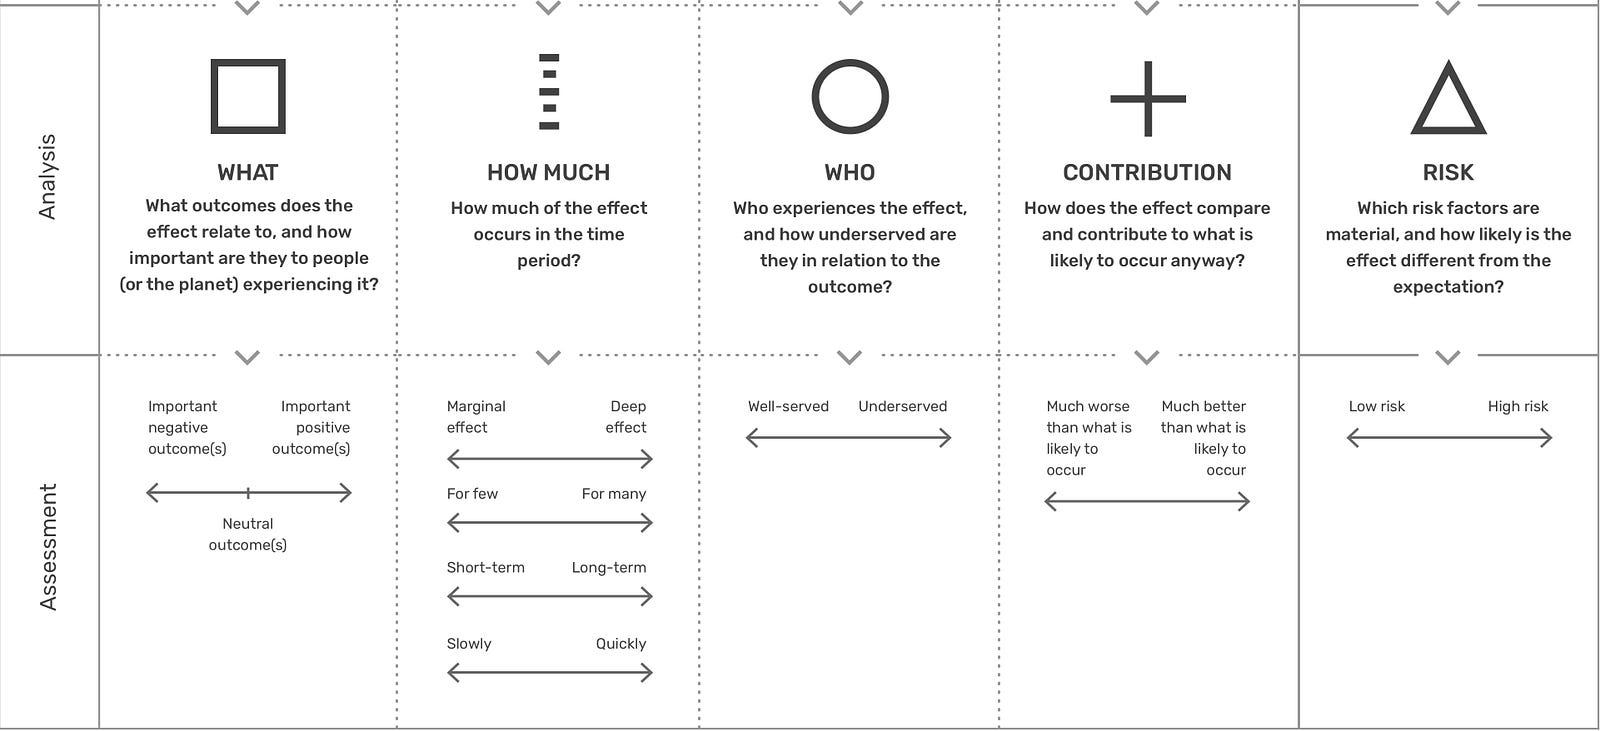
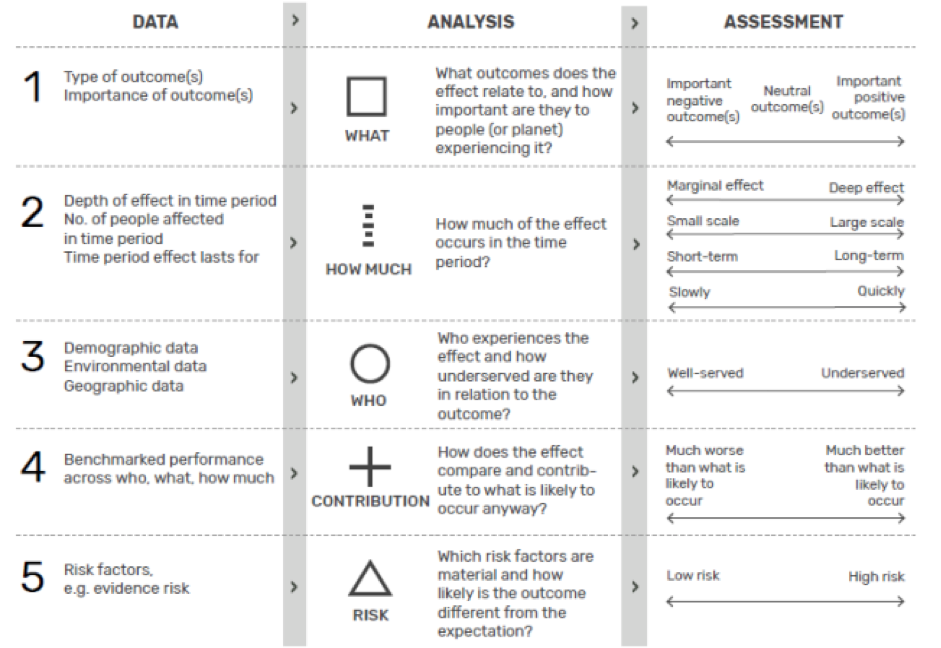
Our impact is the combination of material effects that we have on people and planet. We can understand which effects are material by considering:
1. WHAT outcome(s), positive or negative, the effect drives and whether it is important to the person (or planet) experiencing it
2. WHO experiences the effect and how underserved they are in relation to the outcome(s)
3. HOW MUCH of the effect occurs in terms of its depth, how many people it occurs for, how long it lasts and how quickly it occurs
4. The CONTRIBUTION that the effect makes to what the market would do anyway
5. The RISK that the effect will differ from our expectation
Making sense of data
These five dimensions capture what matters when we experience positive or negative impact and therefore tell us what data we need to collect. A ‘set’ of data across these dimensions provides an opportunity for us to all to interpret, compare and improve our performance over time.
The type of data that a business or investor collects across the five dimensions may vary according to what is appropriate to understand and improve its performance at a point in time. For example, if there is strong existing evidence that our outputs lead to the desired outcomes in comparable contexts, output proxies might be collected initially.
Good impact management will ultimately lead us to go beyond proxy measures to check that people are experiencing what we think they are (direct stakeholder feedback is a good example of how enterprises can collect this type of data cost effectively). And we may choose to go further and use control trials to establish causality or independent evaluation to confirm (or contest) our assessment, including removal of bias. But whatever the type of data used, the data will be useful when we collect and share it as a set across the five dimensions.
Now what?
Using a shared convention for understanding and describing our impact does not mean that we all use the same tools. We all want to continue to use tools that suit our own context. Many that have been identified by practitioners as most useful can be found here.
We can each try to ensure that the five dimensions of impact are visible in our decision-making frameworks and how we talk about our goals. From there, we can look at the data we’re collecting to see if we understand performance across all dimensions. Over the course of the next year, we will be working with a range of organizations and sharing the lessons learned with you on the project’s website.
ImpactAlpha’s five-day-a-week newsletter, The Brief, is read by more than 22,000 professionals and influencers globally. Subscribe here.
Originally published November 29, 2017